


Beyond Steel and Seabed: How ROV Inspections Are Helping Scientists Track Ocean Health
An EyeROV perspective on turning routine subsea checks into long-term ecological records.
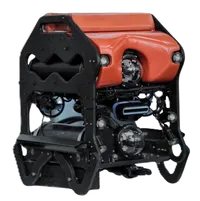
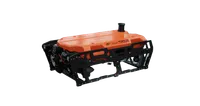
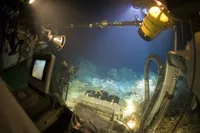
Most people picture underwater inspections as a hunt for the obvious: cracks, corrosion, free spans, missing anodes, scoured foundations. That’s our daily world at EyeROV, keeping critical underwater assets safer and more reliable using high-endurance ROVs and data-driven inspection workflows.
But there’s another story unfolding in the same video stream, one that doesn’t live in steel alone.
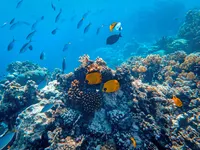
Every dive also records life: schools of fish orbiting structures, algae blooms coating surfaces, barnacle lines shifting with currents, corals staking claims on new edges, silt drifting where it didn’t used to. And when you repeat those inspections, month after month, season after season, you don’t just build an asset history. You build an ocean history.
This is how routine ROV inspections can quietly become one of the most practical ways to track climate-driven shifts in marine ecosystems.
The hidden value in “repeatability”
Ocean science often struggles with a simple challenge: consistency. Even excellent field surveys can be hard to repeat under the same conditions, same location, same angle, same depth, same seasonality, same equipment settings.
Industrial inspections, on the other hand, are built on repetition:
-
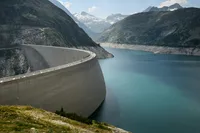
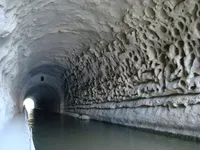
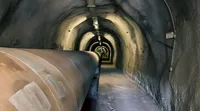
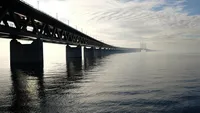
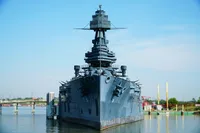
fixed asset locations (ports, pipelines, outfalls, dams, tunnels, hulls)
-
comparable routes and viewpoints
-
consistent lighting/camera profiles
-
recurring schedules driven by maintenance and compliance
At EyeROV, inspections and surveys are designed to produce clear, comparable data for decision-making.
That same discipline, structured capture + repeat cadence, is exactly what ecological monitoring needs.
What changes first when the ocean changes
Climate-driven shifts don’t always announce themselves with a dramatic headline moment. More often, they show up as subtle patterns that only become obvious over time, especially when you have visual records that go back months or years.
Here are a few signals that repeated inspection footage can reveal:
1) Biofouling as an “environmental diary”
Biofouling (the marine growth that colonizes surfaces) is more than a maintenance headache, it’s a living log of local conditions.
Over time, recurring footage can show:
-
changes in dominant species (barnacles vs. algae vs. soft growth)
-
faster or slower growth rates between inspection cycles
-
unusual die-offs or bleaching-like stress patterns
-
seasonal shifts becoming irregular
For an asset team, that’s useful context. For scientists, it’s a proxy record of changing temperature, nutrient loads, turbidity, and water quality.
2) Species behavior around infrastructure
Underwater structures can act like reefs, attracting fish, creating shelter, shaping local microhabitats. In repeated passes, you may notice:
-
new aggregations appearing (or disappearing)
-
altered schooling behavior and predator presence
-
timing changes in breeding/juvenile activity
These patterns can help researchers track distribution shifts—a well-documented outcome of warming oceans, using footage that was originally collected for inspection.
3) Sediment movement and seabed change
Sea-level rise, stronger storms, altered currents—these can reshape seabeds and sediment deposition patterns. Inspection repeatability can capture:
-
increased scour around piles/footings
-
sediment plumes where water used to be clearer
-
changes in seabed texture or slope near assets
This is where infrastructure monitoring and ecosystem monitoring overlap directly: seabed change affects both habitat stability and asset integrity.
From “video” to “dataset”: making inspection footage research-ready
Turning ROV footage into something scientists can confidently use isn’t automatic. It requires structure.
A practical approach looks like this:
Step 1: Standardize what you already do
Many inspection programs already capture metadata (date/time, depth, location, route notes). The goal is to preserve that consistently so it becomes time-series evidence, not isolated clips.
Step 2: Create repeatable “ecology checkpoints”
Alongside engineering checkpoints (welds, joints, interfaces), define a few ecological ones:
-
the same 10–20 seconds on a known “growth hotspot”
-
a seabed patch adjacent to an asset
-
a structural corner that consistently shelters fish
Step 3: Tag what appears (even lightly)
You don’t need a full biological taxonomy to create value. Start with simple tags:
-
“macroalgae dominant”
-
“barnacle dense”
-
“juvenile fish present”
-
“sediment plume”
-
“coral/soft coral visible”
Over time, these tags become a map of change.
At EyeROV, our broader direction is aligned with making underwater operations more data-driven through ROV systems and analytics workflows.
That same mindset, structured capture + analysis, translates naturally into ecological tracking.
Why EyeROV cares about this (and why now)
EyeROV was founded with a vision to push underwater exploration forward using indigenous ROV technology and safer, more efficient inspection methods.
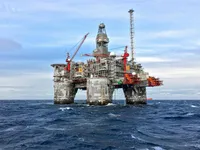
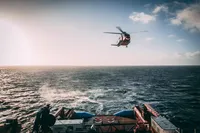
We work across demanding underwater environments and mission types, from infrastructure inspection to survey and research-oriented operations.
What we’ve learned in the field is simple:
The ocean is not “background” to an inspection. It’s the main character.
And as climate pressures accelerate, the footage we collect can serve a bigger purpose—without adding extra disturbance, extra vessel days, or extra diver risk.
A collaboration model that actually works
We’ve found the most realistic path is not “turn every inspection into a scientific expedition.” It’s smaller and smarter:
-
Asset owners continue inspections for safety and compliance
-
ROV operators capture with consistent, repeatable methodology
-
Researchers define lightweight tagging frameworks and look for long-term patterns
-
Everyone benefits from a richer understanding of the underwater environment
In other words: one mission, two value streams.
Closing: the future is time-series oceans
In the past, the underwater world was documented in fragments, one dive here, one expedition there. Today, repeated inspections can create something rare and powerful: a continuous visual record of how marine life and underwater conditions evolve around us.
At EyeROV, we’ll always care about steel, concrete, and critical infrastructure. But we’re increasingly conscious that every inspection is also a chapter in a much larger story, one written by currents, temperature, turbidity… and life itself.
If you’re an asset owner, port authority, offshore operator, or research group interested in building inspection programs that double as ocean-health records, we’d love to collaborate.